Did you know that in the United States, seven out of every 10 households own a pet? From unconditional love to emotional support, pets are a vital part of their owners’ lives. Many care for their pets as if they were family members.
This is hardly limited to America, though. We’ve set out to compile the definitive list of pet ownership statistics in US (and worldwide) to show how the bond between humans and animals transcends continents and languages.
Pet Ownership Statistics in US 2022
Read on to learn everything you need to know about what pet ownership looks like across the world. It’ll warm your heart and it might just come in handy for your next trivia night.
US household pet ownership statistics
Pet ownership statistics in US have grown steadily over the years. While dogs are the most popular pet overall—woof woof, keep it up—there is plenty of diversity in pet ownership.
- 70% of U.S. households (90.5 million homes) owned a pet as of 2022.
- 69 million U.S. households have a pet dog, compared to 45.3 million with a cat.
- 3.5 million American households own a horse, and 2.9 million own a saltwater fish.
- From March 2020 to May 2021 alone, roughly 1 in 5 US households acquired a dog or cat.
- Pet ownership has steadily risen in the US: 56% of households owned a pet in 1988, compared to 67% as recently as 2019.
Let’s dive a bit deeper into pet ownership statistics in US to see pet ownership trends by state.
Read Also: The Most Popular Animals Owned As Pets In The US
Pet ownership statistics in US by state
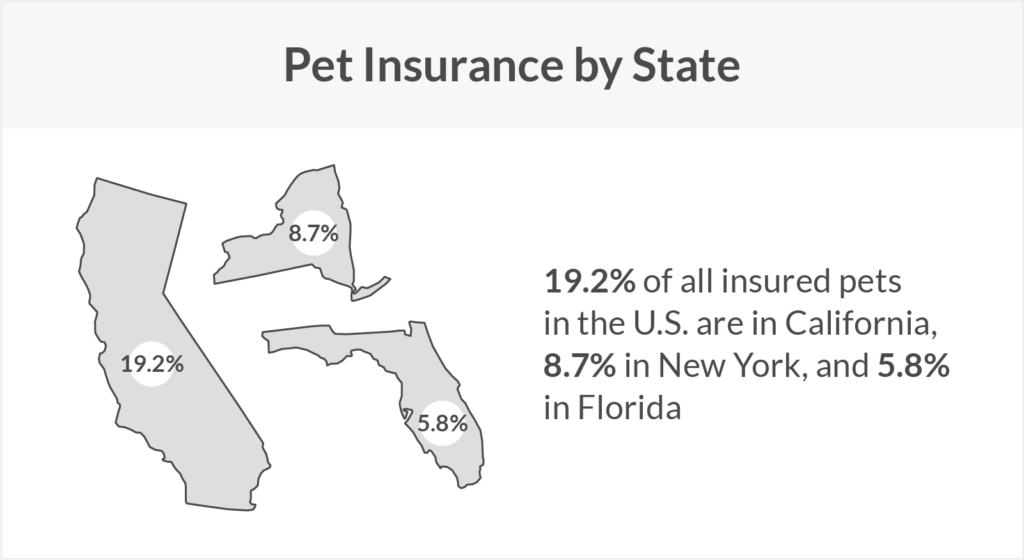
When breaking down some stats by state, we find some particularly interesting details. Who knew that Californians loved pet insurance so much, or that residents of D.C. weren’t in much need of furry friends?
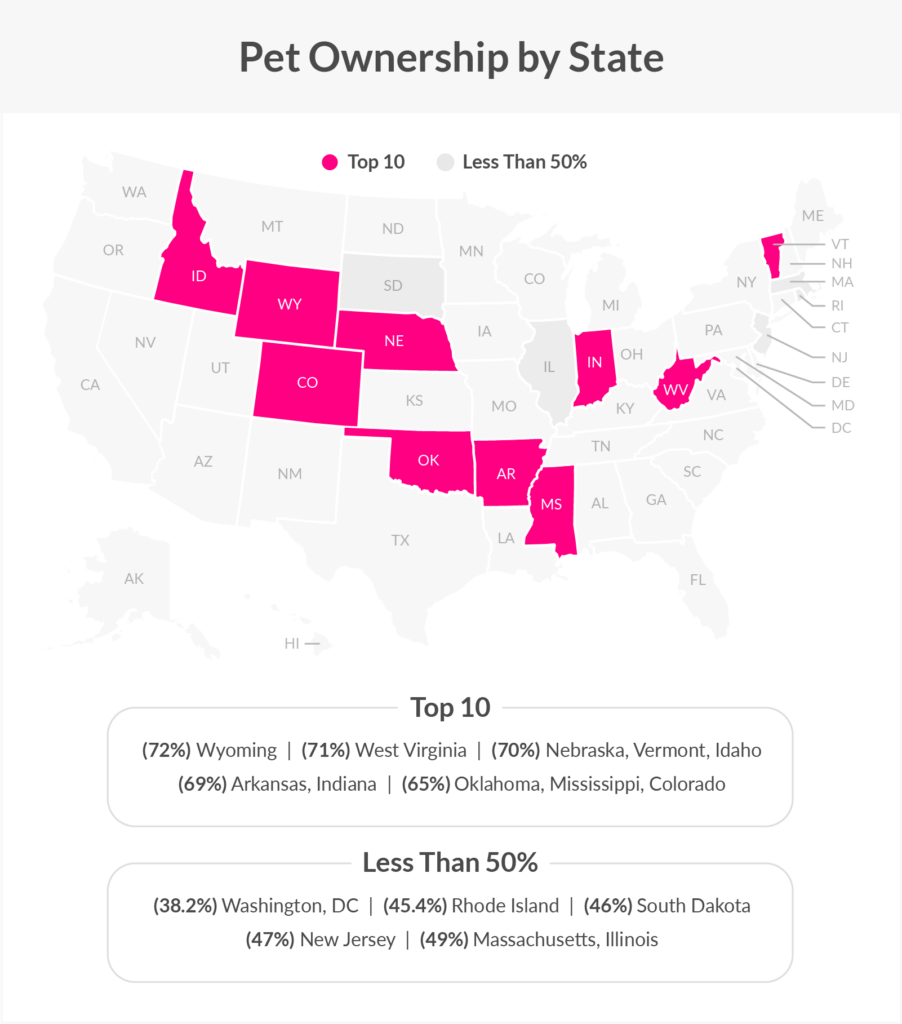
- Wyoming is the #1 pet-owning state, with 72% of households owning at least one pet.
- Following WY, the top 10 states with the highest percentages of pet-owning households are West Virginia (71%), Nebraska (70%), Vermont (70%), Idaho (70%), Arkansas (69%), Indiana (69%), Oklahoma (65%), Mississippi (65%), and Colorado (65%).
- Washington, D.C. (while not technically a state) has the lowest percentage of household pet ownership (38.2%), followed by Rhode Island (45.4%).
- Less than half of households own pets in the following states: South Dakota (46%), New Jersey (47%), Massachusetts (49%), and Illinois (49%).

- 19.2% of all insured American pets reside in California.

Cats vs. Dogs: Pet ownership statistics in US
No study of pet ownership statistics would be complete without exploring the rivalry between cats and dogs. Here’s how cat and dog ownership stack up in the US, with a special focus on adoption factors.
- As of 2016, 85% of households with dogs consider their dog to be a family member, compared to 76% of households with cats.
- Roughly 40% of dog owners and 46% of cat owners found their pets through word of mouth.
- Approximately 31% of cat owners obtained their pet via an animal shelter/humane society, compared to 23% of dog owners.
- 34% of dog owners obtained their pet via a breeder, compared to just 3% of cat owners.
- 27% of pet cats were once strays, compared to 6% of pet dogs.
- Approximately 2 million shelter dogs and 2.1 million shelter cats are adopted in the US each year.
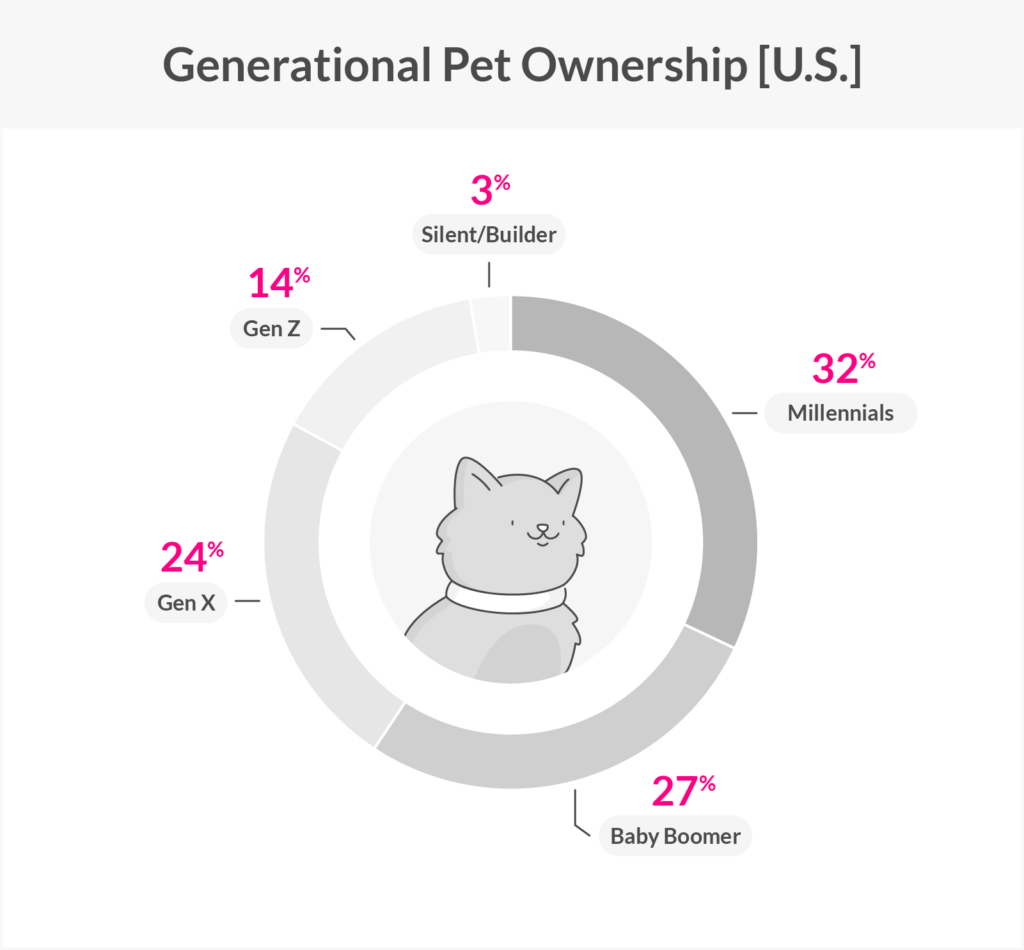
The generation divide among pet parents
So far we’ve given the animals plenty of attention. But is there more we can learn about pet owners? For example, how does pet ownership vary along generational lines in the U.S.? Here’s what the latest data shows.

2 thoughts on “Pet Ownership Statistics in US 2022”